Rising Electricity Rates in California
It’s tough for businesses to keep up with electric utility policy and rate changes that result in California’s rising electricity rates for SCE, SDGE and PGE Customers. To simplify everything – your bills will be at least 4% higher each year. This is based on the average year over year total cost per kWh growth from 1990 to 2025. There can be a lot said about electricity costs in California (as well as other costs) over the past few years. One theme reigns supreme no matter who your utility provider is, costs have gone up – fast!
Non-profit organizations such as CALSSA.org and for profit software like Energy Toolbase have their own methods of estimating rate increases, all seem to agree… Since the 1990’s average year over year energy rate growth was around 3%, until recent years started to see even higher increases.
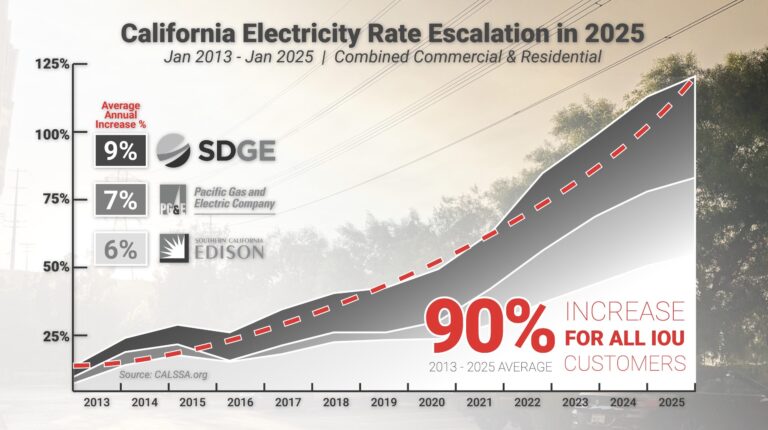
Table of Contents
This graph shows that from 2013 to 2025, energy rates have increased by at least 90% for all IOU customers in California. The new normal looks closer to 4% averaged out over all public and municipal utilities. This means, a business can expect to pay 4% more per kWh each year, and this growth is what we now use to project our customers for energy costs.
Tracking electricity rates can be as simple as tracking and comparing several businesses’ electricity bills over a period of time, to as complicated as digging through years and years of eia.gov Public Utilities revenue and dividing it by the total electricity usage (kWh) data.
This graph uses data gathered by CALSSA to show how much annual rates have increased for California residential and commercial IOU customers (SDGE, SCE, PGE) from 2013 to 2024. San Diego Gas & Electric (SDGE) has seen the highest annual electricity rate increases with 9% average, followed by Pacific Gas and Electric (PGE) at 7% and Southern California Edison (SCE) at 6%. These are just average annual increases, as both residential and commercial combined, this presents a conservative average as businesses across California are facing even higher year-over-year increases of their electricity rates.
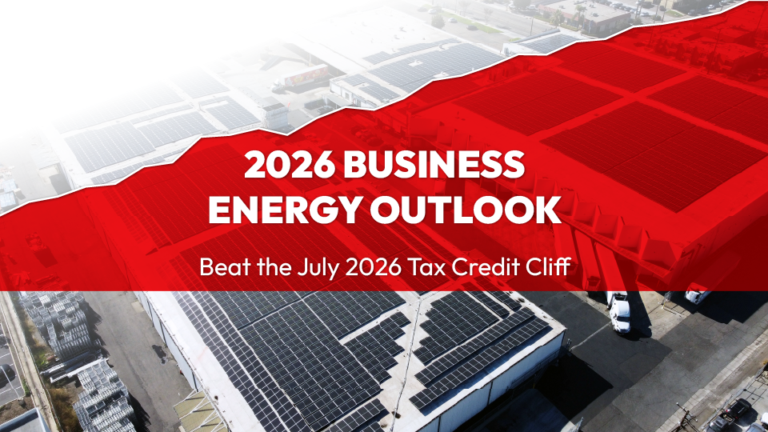
2026 Business Electricity Costs: Why Companies Are Pivoting
- January 5, 2026
- Tyler Crossno
California Rising Electricity Rates Case Study
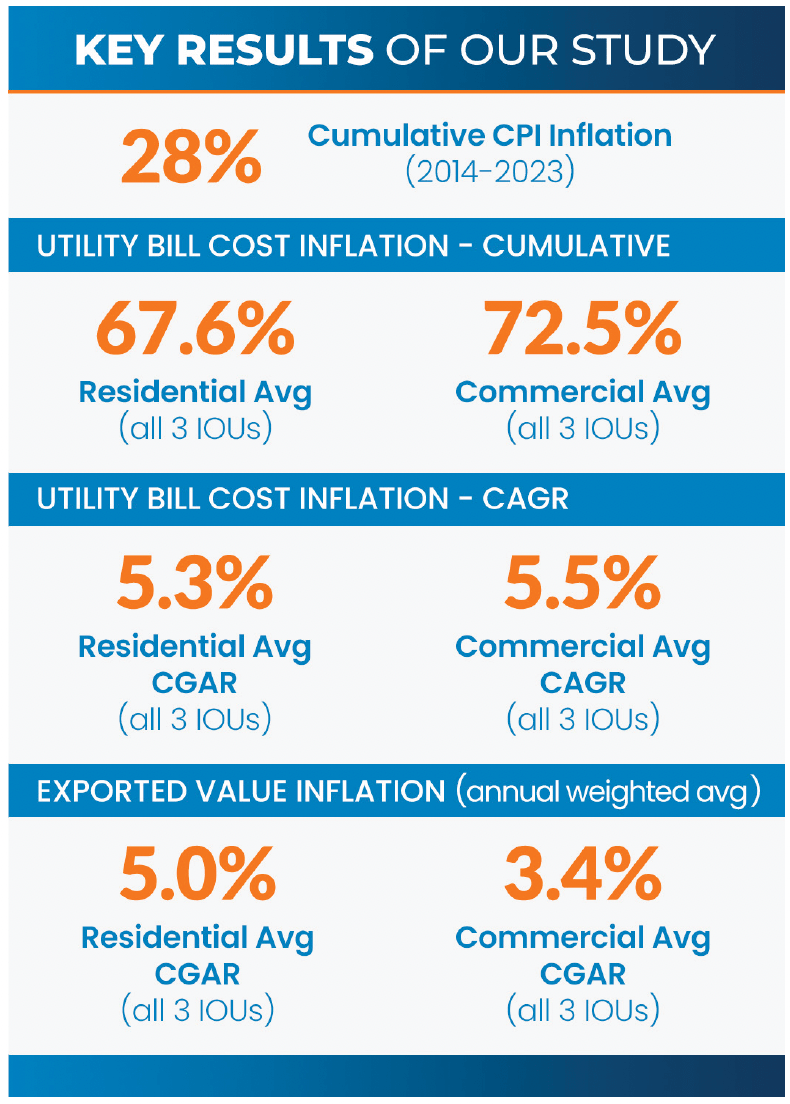
A recent whitepaper by Energy Toolbase has shed light on the upward trend of electric bill costs in California, particularly for businesses within investor-owned utility territories. In this blog post, we’ll dive into the key findings of this study, compare similar findings in our past studies, and discuss how your business can mitigate the impact of these rising electricity costs.
According to the Energy Toolbase whitepaper, the retail electric bill costs in California’s big three IOUs; Pacific Gas & Electric (PGE), Southern California Edison (SCE), and San Diego Gas & Electric (SDGE) – have seen a Compound Annual Growth Rate (CAGR) between 28% to 63% from 2014 to 2023. On a cumulative basis, commercial customer bills have increased anywhere from 47% to 104%, depending on the utility.
The study attributes the rise in commercial electricity rates to many factors such as; fuel / energy cost, changes in demand, infrastructure investments, regulatory / policy changes, and environmental mandates. New frameworks, such as the NEM 3 / net billing tariff, introduce more variables to consider when calculating inflation for utility bills and avoided costs from solar + storage projects in the future.
In our experience, California commercial businesses are seeing substantial electricity rate growth with summer seeing historical highs. Rate growth will more than likely outpace historical averages.
In our internal case study of a Southern California Edison (SCE) commercial electricity customer, we found their electricity rate had increased by more than 37% in just 5 years. To continue this study, we identified a customer within the San Diego Gas & Electric (SDG&E) service area, the commercial business saw a shocking increase of 41% just from 2017 to 2022.
Rising Municipal Electricity Rates
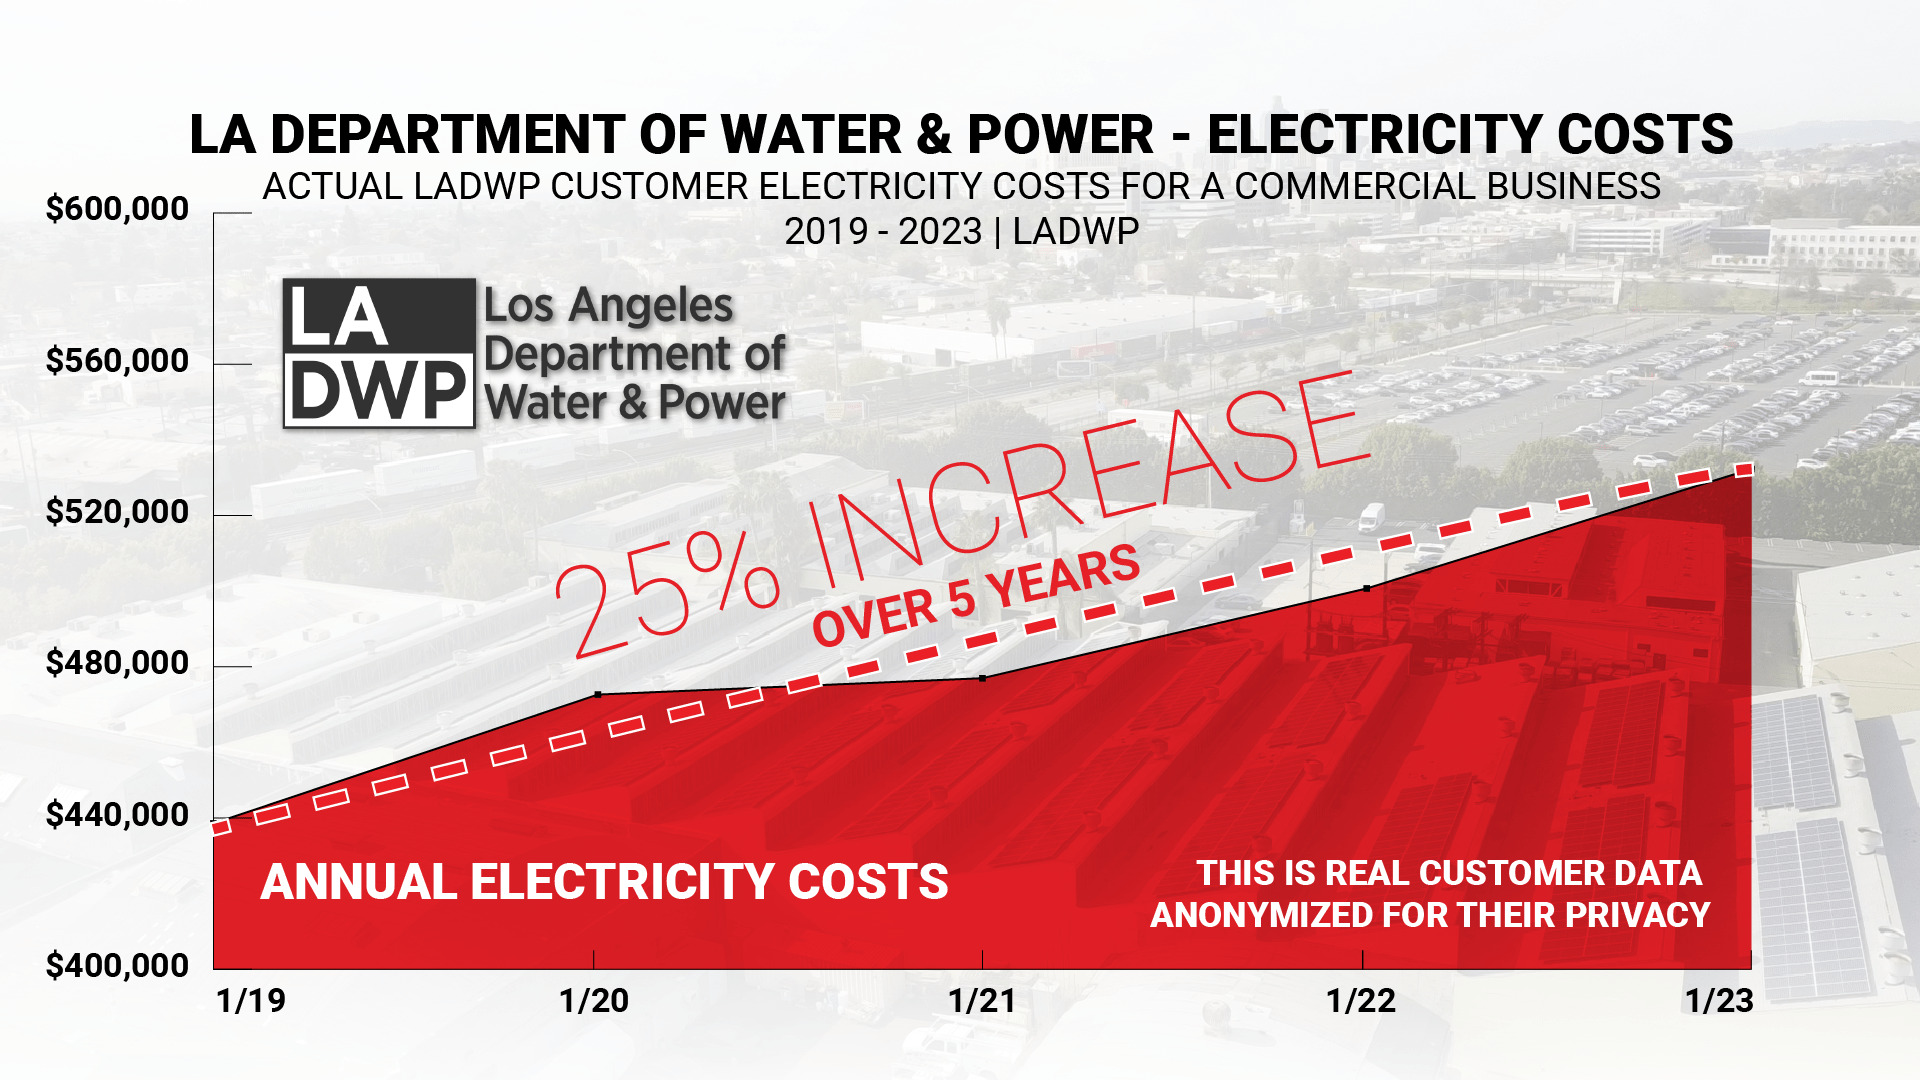
Even as many IOU customers pay more, municipal utility customers also continue to pay constantly increasing electricity rates. Even as municipal providers are more accountable locally than IOUs like SCE, PGE and SDGE, they often offer lower electricity rates comparatively. Just from January 2019 through January 2023, our team collected data from one of our customers to learn over that short period of time this businesses electricity costs had increased by 25%.
Municipal public utility providers are established in cities like Anaheim, Riverside and Vernon and offer cost-effective electricity rate alternatives to California’s second-largest investor-owned utility, Southern California Edison (SCE). Tracking a manufacturing facility from June 2019 through January 2023, this Anaheim Public Utilities customer was spending 24% more on electricity bills in 2023 – an annual average rate increase of almost 6%.
Time-of-use Billing
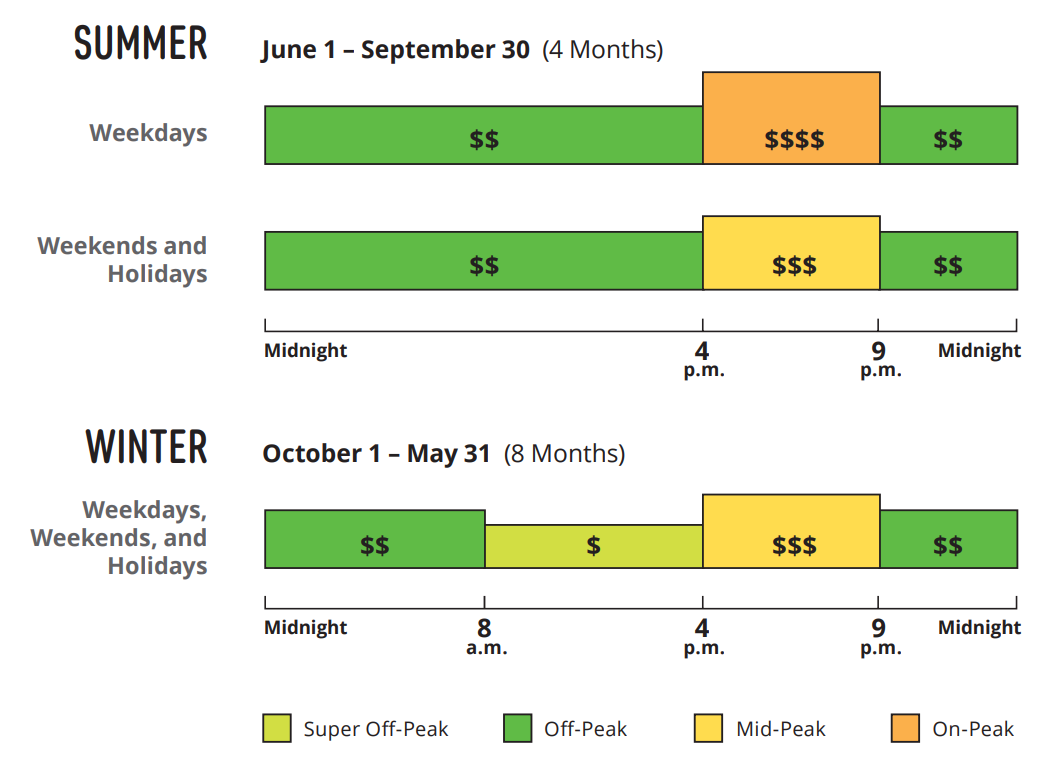
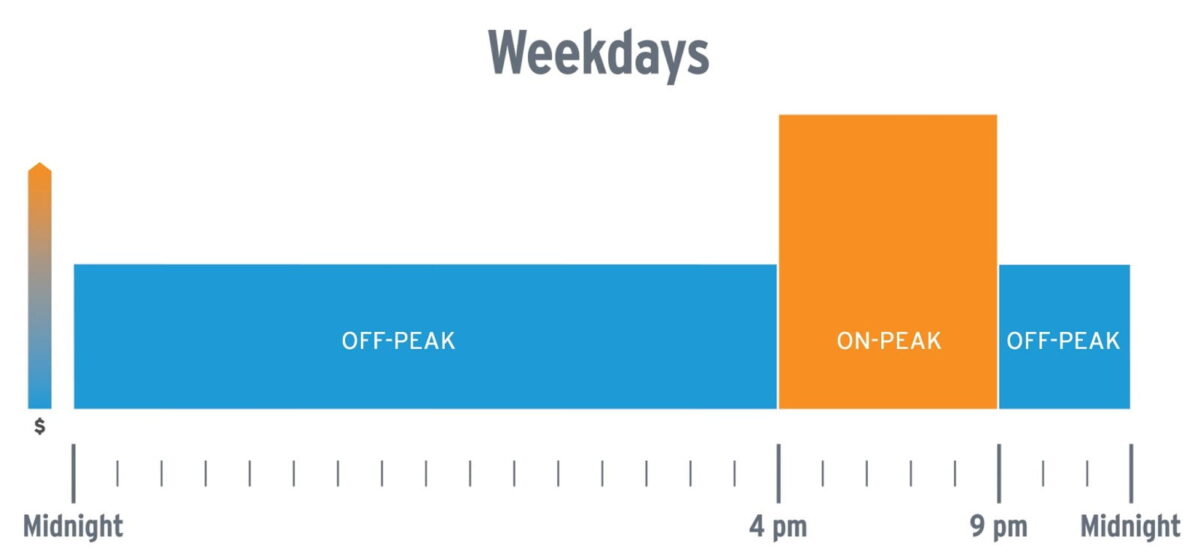
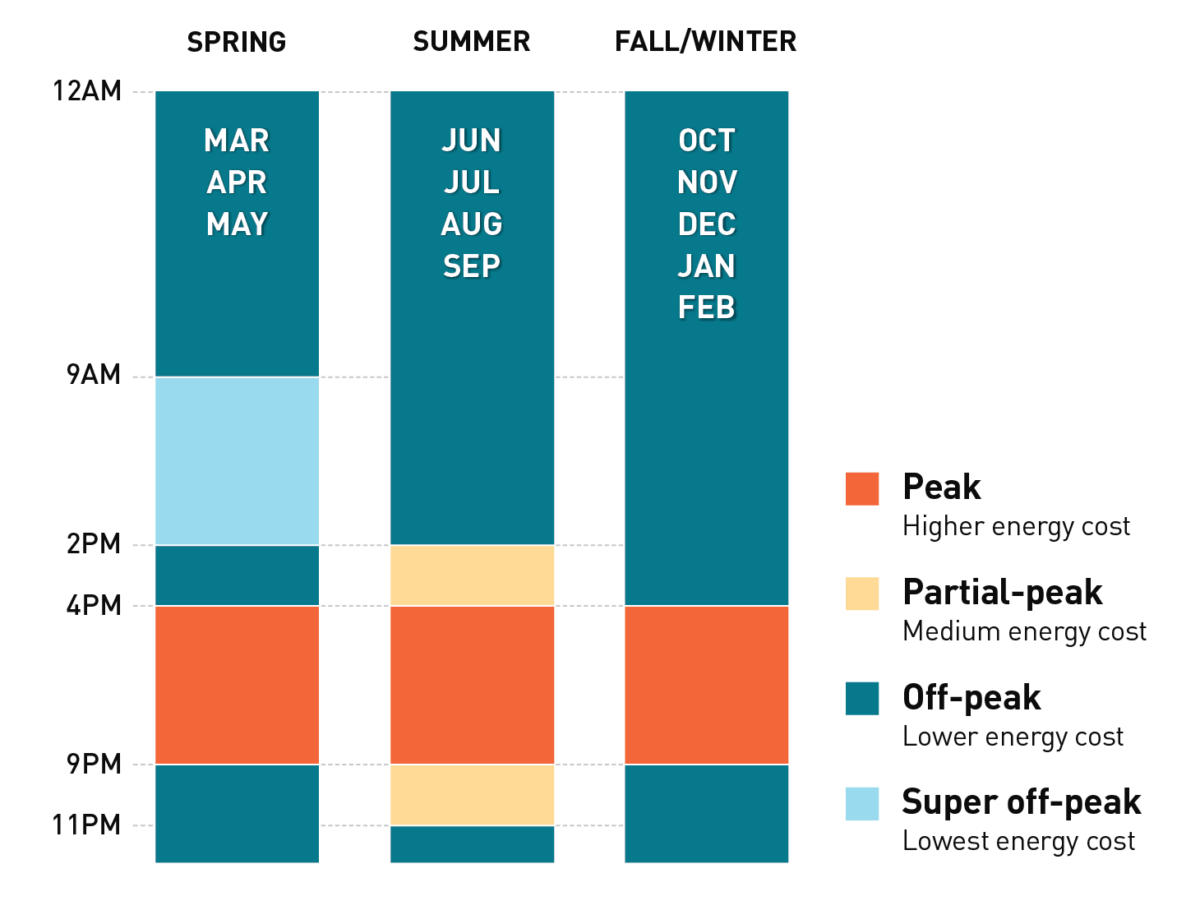
TOU rates are divided into different time blocks throughout the day, typically categorized as peak, off-peak, and sometimes mid-peak. Peak hours are when demand for electricity is highest, often during the late afternoon and early evening. Off-peak hours are when demand is lowest, usually at night and early in the morning. During peak hours, electricity rates are higher due to the increased demand on the power grid. Conversely, during off-peak hours, rates are lower. This pricing structure helps utilities encourage consumers to shift their electricity usage to times when demand is lower, helping to balance the load on the grid.
SCE TOU Schedule
SDG&E TOU Schedule
PG&E TOU Schedule
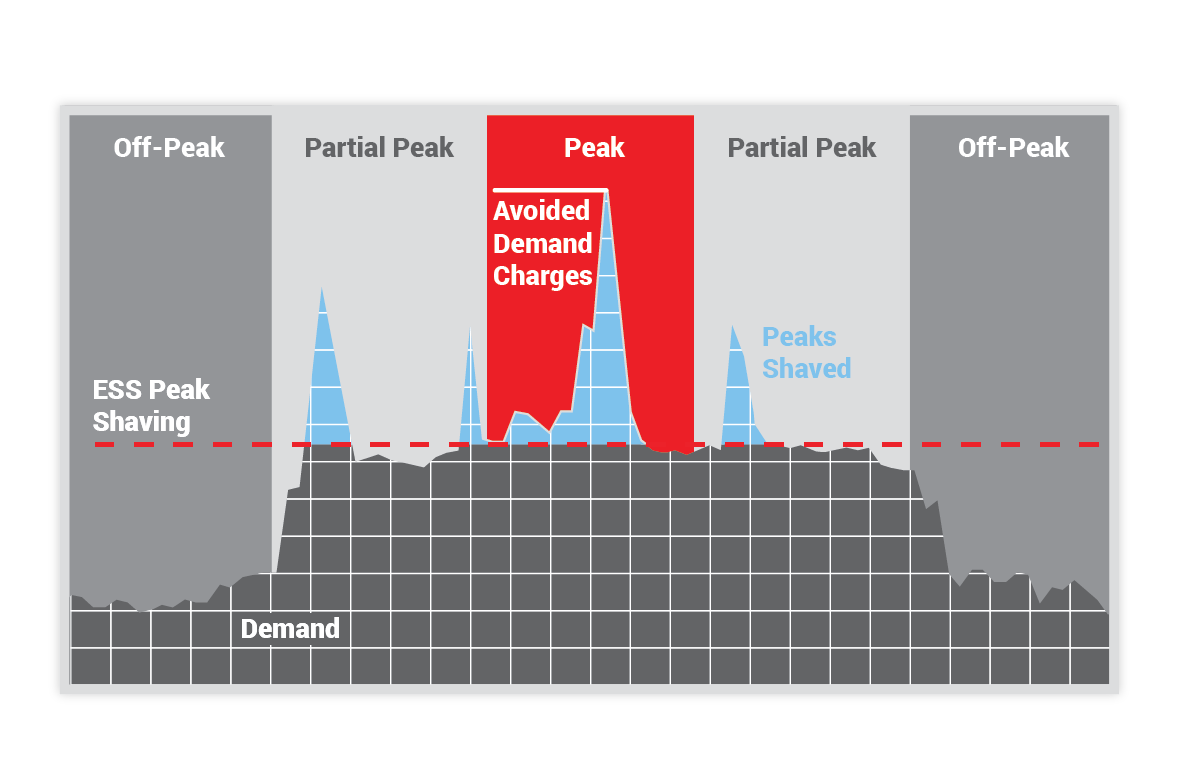
Demand Charges & Peak Shaving
Demand charges are the most expensive energy costs on an electricity bill. Utilities apply these charges for intense spikes in energy demand, even if the electricity is only used for a moment, the entire 15-minute interval period incurs the demand charge.
Not always during peak time-of-use, but made more expensive when it is, demand charges are often a motivator for businesses to try load shifting as a solution only to learn that peak shaving with energy storage is the best way to avoid drastic spikes in electricity demand. As rates increase, demand charges will be more intense and businesses that rely on a certain cost of energy will have to adapt.
Understanding Electricity Bills
Take a step towards controlling rising electricity rates from SCE, PGE and SDGE by understanding how your electricity provider charges you for the energy your business needs.
If your California business has noticed a significant increase to your electricity prices, this guide can help you understand where those increased costs are coming from.
A kilowatt (kW) is a measurement that defines the intensity of the electricity being used.
Kilowatt hours (kWh) are the result of Intensity multiplied by time, just think of this as a unit of energy.
For example, if you use ten 100-watt-intensity light bulbs for an hour, you would be charged for one kilowatt hour unit. Learn more about how to understand your electricity bills here.
California businesses are bracing for a dramatic rise in energy costs as the state’s electricity demands continue to surge in 2025. While powering energy-intensive artificial intelligence (AI) technologies and supporting the clean energy transition are key factors, the primary driver behind rising rates is unchecked utility spending.
Investor-owned utilities have increased their transmission and distribution (T&D) spending by 300% since 2005, passing these costs onto ratepayers.
For businesses, this escalating trend makes 2025 a pivotal year to consider adopting commercial solar and energy storage solutions to hedge against these financial pressures. Here’s why acting now can future-proof your business and lock in savings.
As 2024 progresses, California businesses are facing an unprecedented rise in electricity rates, outpacing inflation and creating significant financial challenges. The California Public Utilities Commission (CPUC) recently reported that commercial electricity rates have been increasing faster than inflation, driven by various factors, including wildfire mitigation costs and the impacts of changes to net metering programs.
Rates are rising across California’s major investor-owned utilities – Southern California Edison (SCE), San Diego Gas & Electric (SDG&E), and Pacific Gas and Electric (PG&E). Learn how businesses like these have found relief through commercial solar and energy storage solutions.

The recent approval by the California Public Utilities Commission (CPUC) for an 11% rate increase for PGE in 2024 is a clear indicator of this trend. According to a study by the California Solar and Storage Association (CALSSA), the rate of increase in electricity costs from 2013 to 2024 far exceeded the expected 3% annual rise. On average, SDGE’s rates soared by 9% every year, followed by PGE at 7% and SCE at 6% as shown on the graph below.
Communities are starting to feel the pinch, with notable pushback, such as a petition in San Diego to replace SDG&E with a non-profit utility, gaining attention in December 2023.
For businesses, reducing dependence on California’s investor-owned utilities is a strategic move to control and potentially lower their electricity expenditures.
Learn how 2024 electricity rates are increasing for businesses in Los Angeles paying increasing bills to Southern California Edison and Pacific Gas & Electric.
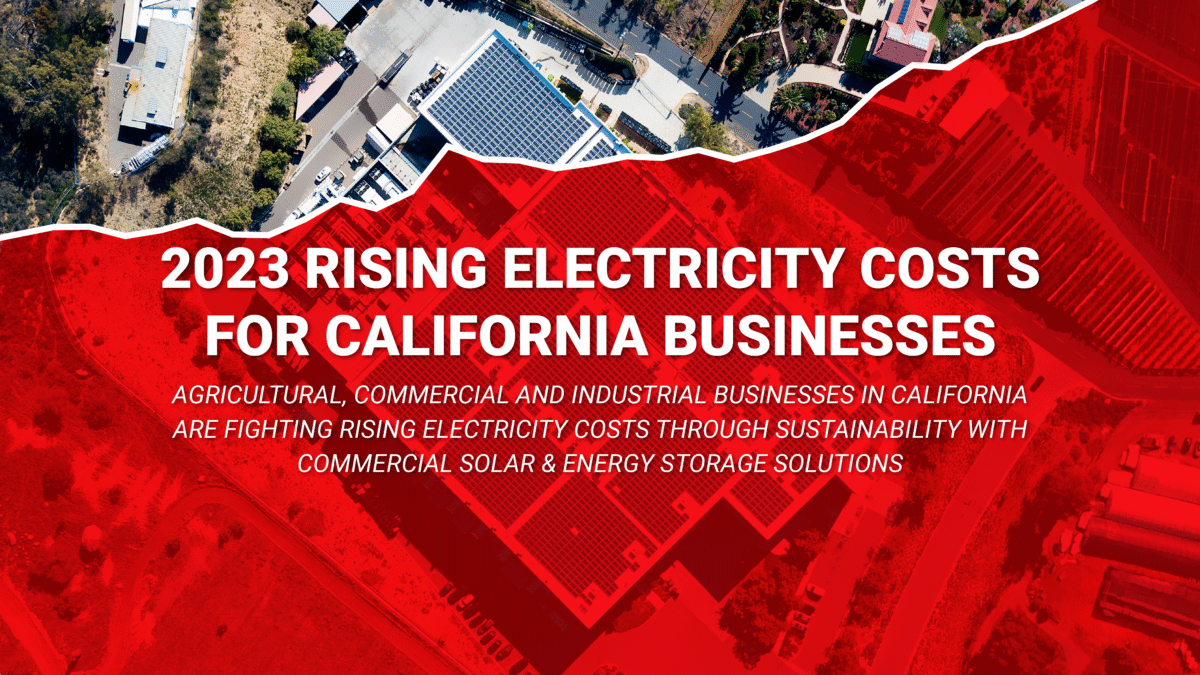
As the cost of electricity in California for businesses increases, many agricultural, commercial and industrial businesses are fighting these rising rates sustainably with commercial solar and energy storage.
For a majority of utility customers in California, businesses included, the average commercial retail price of electricity has increased on average by about 3.5% per year from 2001 to 2020. However, after global events in 2020 such as the coronavirus pandemic, rates through 2023 have risen much higher than previous averages. Some customers are paying annual increases as high as 23%.
This was revealed to us in a case study conducted by our team looking at customer utility data through the past few years. Here is our report on electricity costs for municipal utility providers.
Learn how 2023 electricity rates are increasing for businesses in different IOU territories such as San Diego Gas and Electric, Southern California Edison or Pacific Gas and Electric.
California Commercial and Industrial Electricity Rate Growth from 1990 to 2021
Rising industrial electricity rates apply most commonly to manufacturers, plastics industry, aerospace, and other similar industries in California. These businesses are some of the states highest electricity users and they pay a premium for it.
Commercial rates apply mostly to flex space, office building, retail and other similar industries. These are generally smaller businesses or multi-tenant spaces with moderate electricity usage. A lot of these businesses do not have the luxury of running earlier hours to avoid peak TOU pricing.
As more businesses choose to avoid these rising costs, renewable solutions become more prevalent. California was briefly powered exclusively by renewable sources, serving just under 100% of the State’s demand with solar contributing two-thirds of that supply.
Controlling California's Rising Electricity Costs With Commercial Solar
California’s businesses have options for lowering these rising electricity costs. The most effective and widely accepted is commercial solar, sometimes paired with energy storage if applicable. Solar developers like Revel Energy offset their customers’ energy usage by an average of 60-80% depending on the project profile (typically usage versus square footage of roof space).
If your commercial, industrial, or agricultural company has noticed these rising business electricity costs and prices, contact our expert team today to learn what solutions may be available.
About Revel Energy
Revel is on a mission. Dedicated to renewable energy solutions since 2009, Revel Energy was formed to provide Commercial, Industrial and Agricultural businesses with alternative energy beyond solar. Revel stands out from the competition by paying attention to what makes good business sense to each individual client, implementing a wider range of technologies to free up capital and make businesses sustainable and more profitable.
OUR SERVICES
TURNKEY COMMERCIAL GRADE SOLAR, ENERGY STORAGE, LED LIGHTING AND MORE.
PROFESSIONAL GUIDANCE
CUSTOM TAILORED PLANNING
CONSTRUCTION & INSTALLATION
CSLB #1106092
See how these businesses saved on electricity, gained valuable tax credits and rebates with commercial solar and energy storage.
Client Testimonial: Kelemen Company
Corporate Business Park in Irvine, CA has created significant electricity cost savings through commercial solar installed across the 5-building business park.
Client Testimonial: Tice Gardner & Fujimoto LLP
See how this CPA firm saved on electricity and gained valuable tax credits through commercial solar that they used to keep cash in the businesses.
Commercial grade rooftop solar is ideal for: manufacturing, warehousing, logistics, industrial, retail, hospitality buildings and more with over 10,000 sq. ft. rooftops.
CARPORT SOLAR
Free standing carport solar generates added solar power for properties with limited rooftop space. Added benefits include shading and protection for employees vehicles.
Crucial for reducing peak demand charges. Automated to supply electricity when your panels won’t. Energy storage is ideal for businesses that incur significant peak charges.
As the popularity of electric vehicles increase, so does the demand for on-site charging. This sustainable amenity has become a parking lot fixture for competitive employers.