Rising Electricity Costs in 2021
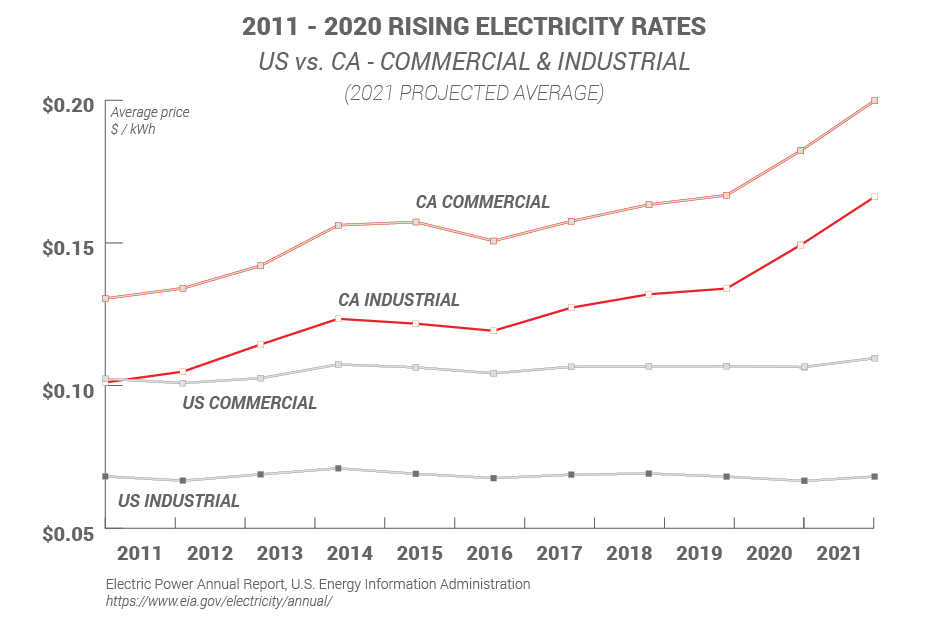
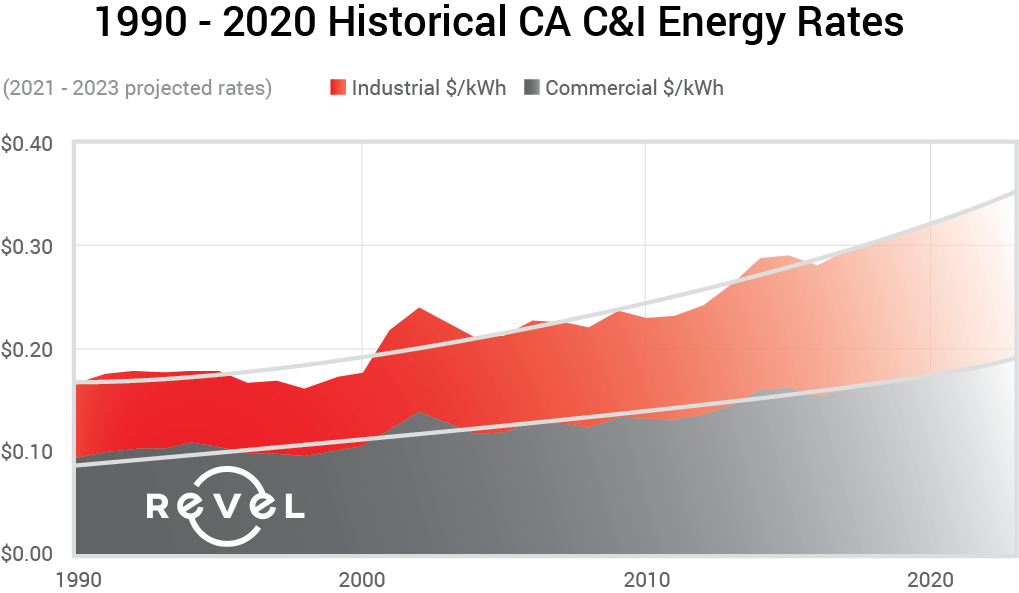
It is tough for California businesses to keep up with electric utility policy and rate changes as they face rising electricity costs in 2021. To simplify everything – your bills will be 3% higher each year. This is based on the average year over year total cost per kWh growth from 1990 to 2020 Q1.
The real red flag is that in 2020, major rate increases were approved by the California Public Utilities Commission. One example was this spring PG&E was able to increase rates by 8% to pay for their neglected infrastructure. SDG&E and SCE have similar approved rate increases that are less publicized.
Proposed policy changes to Net Energy Metering 3.0 (NEM 3.0) by the utilities could significantly increase payback periods and reduce potential savings that solar provides.
For 2021, California businesses are set to see rising electricity costs with summer seeing historical highs. For the year, rate growth will more than likely outpace historical averages.
Below are a few graphs and images to pay attention to as they will be very important in understanding why you are paying more for your electricity than ever.

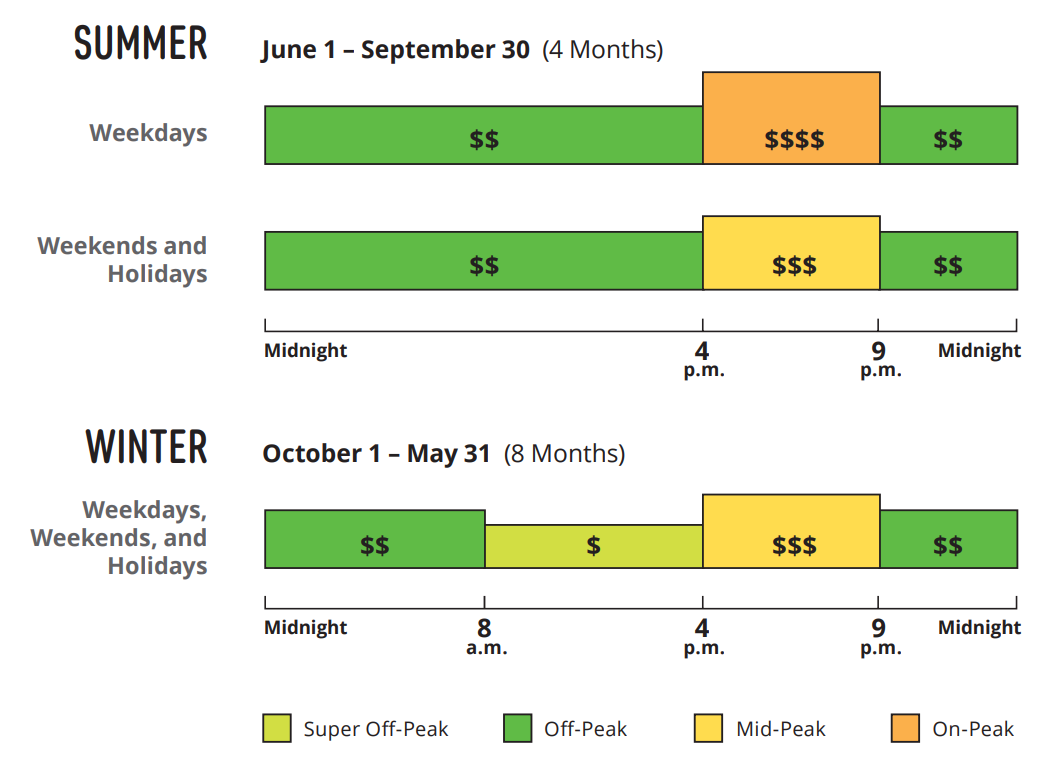
Time-of-use
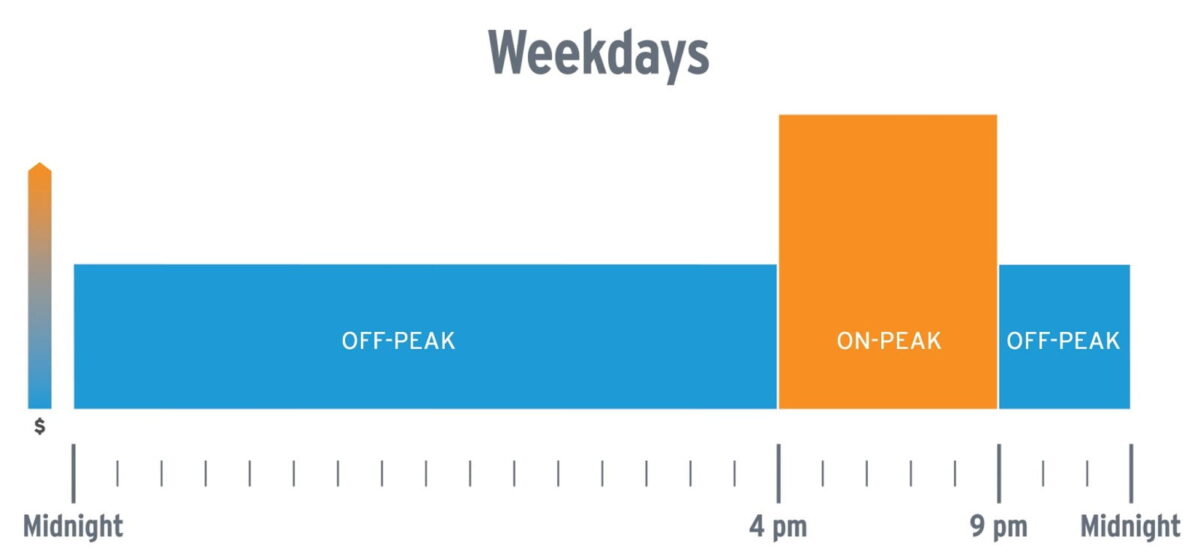
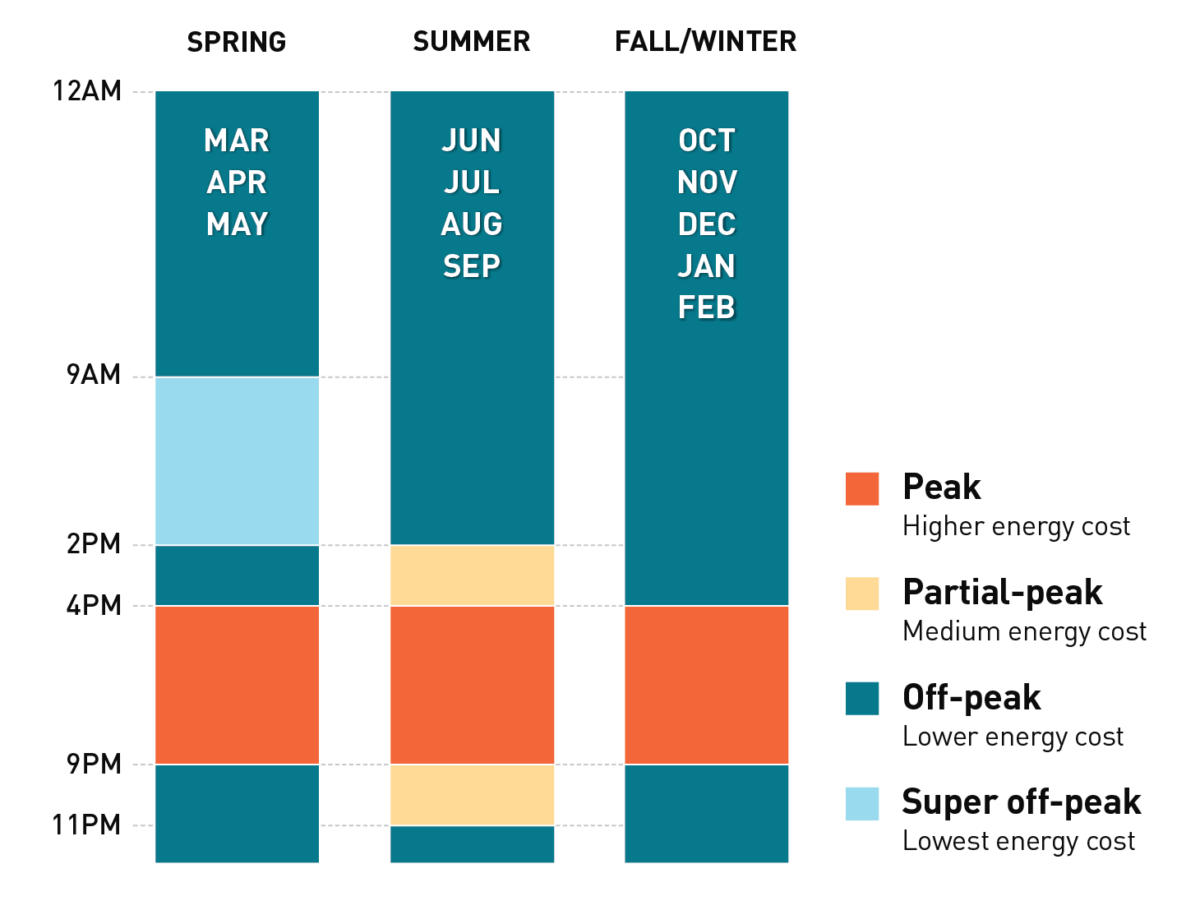
Summer TOU plans hit business at the end of May, significantly increasing rates to counter high demand. Time-of-use is designed to charge customers more for electricity at times when demand is high, when customers need it most…
SCE TOU Schedule
SDG&E TOU Schedule
PG&E TOU Schedule
California Commercial and Industrial Rising Electricity Costs in 2021
Industrial rates (in red) apply most commonly to manufacturers, plastics industry, aerospace, and other similar industries. These businesses are some of the states highest electricity users and they pay a premium for it.
Commercial rates apply mostly to flex space, office building, retail and other similar industries. These are generally smaller businesses or multi-tenant spaces with moderate electricity usage. A lot of these businesses do not have the luxury of running earlier hours to avoid peak TOU pricing.
Controlling Cost With Commercial Solar
Solar is uniquely suited to help demand on the grid, as events of high demand are typically when businesses are operating and the sun is shining, utilities access overproduction from existing solar systems. Utilities reward owners of solar systems that contribute during these events with credits at the value that the energy was produced.
This is called Net Energy Metering and these credits cover significant energy costs accrued when that solar system isn’t generating energy. Conveniently for utilities, solar systems across the grid help alleviate energy costs for everyone by offsetting this demand. However, changes are coming for this important program, learn more here: Net Energy Metering Explained.
California businesses have options for lowering their electricity bills. The most effective and widely accepted is commercial solar, sometimes paired with energy storage if applicable. Solar developers like Revel Energy offset their customers’ energy usage by an average of 60-80% depending on the project profile (typically usage versus square footage of roof space).
Click the link below that resembles your monthly electricity costs below for a table to show how your costs could increase.
$3,000/Mo – $5,000/Mo – $7,500/Mo – $10,000/Mo – $15,000/Mo – $20,000/Mo – $50,000/Mo
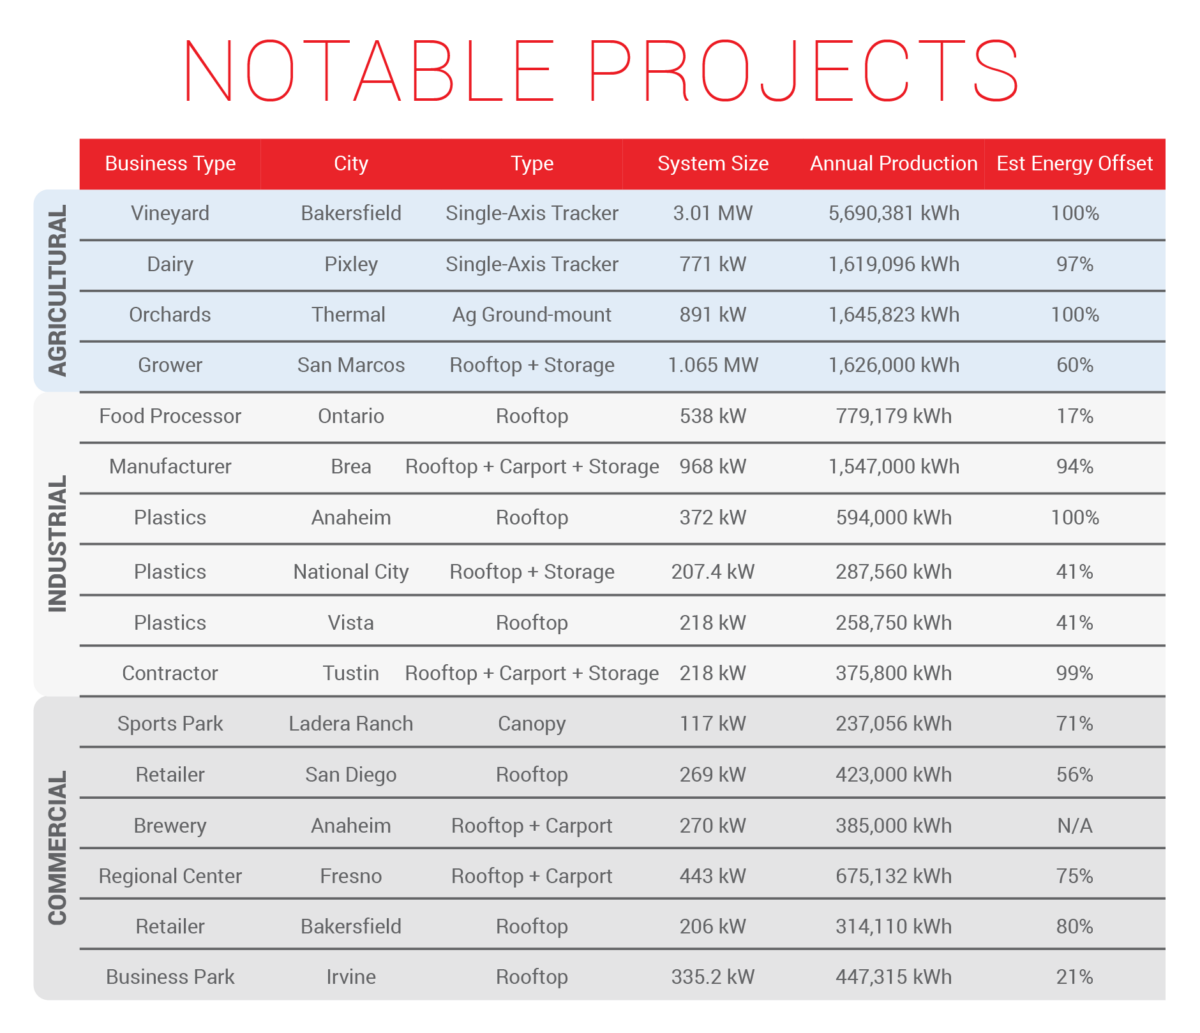
Below are some examples of California businesses that lower their electricity bills with commercial solar.
